
Reporting & Analytics.
Every call, every payment, every transfer — visible in real time.
Six views, one source of truth.
Daily Call Totals
Hourly breakdown across the day, with peak/off-peak highlighted.
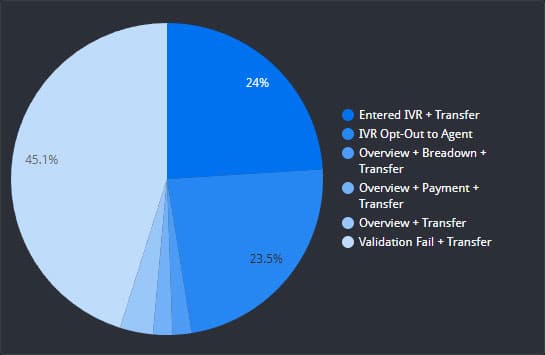
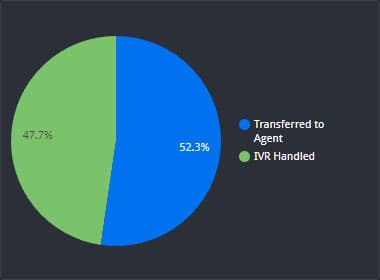
Calls Transferred to Agent
Volume and reason codes, to show where automation hands off.
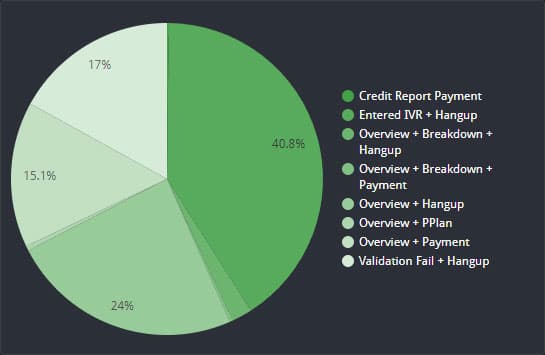
IVR-Handled Calls
Self-service completion rate, by intent.
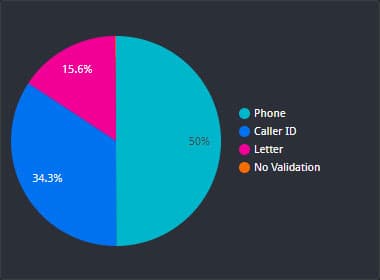
IVR Validation
Authentication success/failure trends.
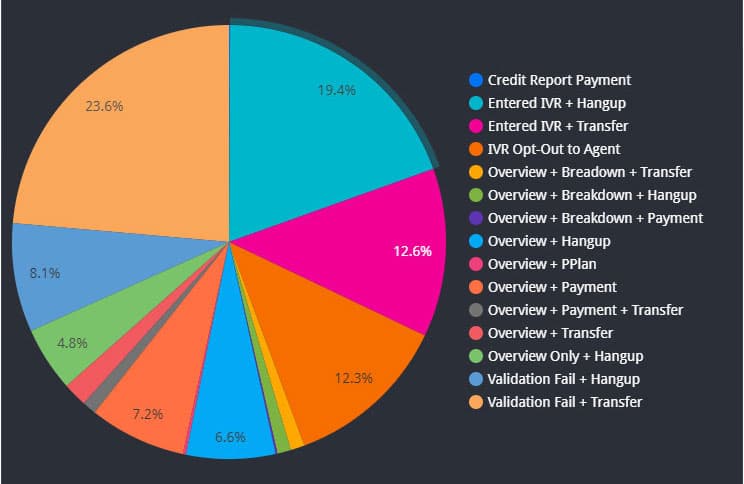
General Call Breakdown
Inbound vs outbound, by purpose (payment, info, dispute, support).
Total Validations
Overall authentication and verification volume over time.
Operational questions, decided fast.
Where in the flow are customers dropping off?
Which dialing strategy is converting on which portfolio?
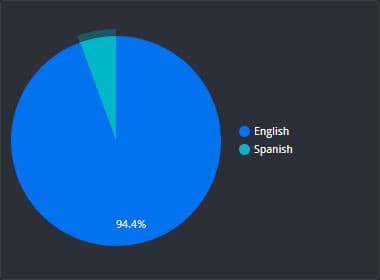
What's the language mix of our caller base this quarter?
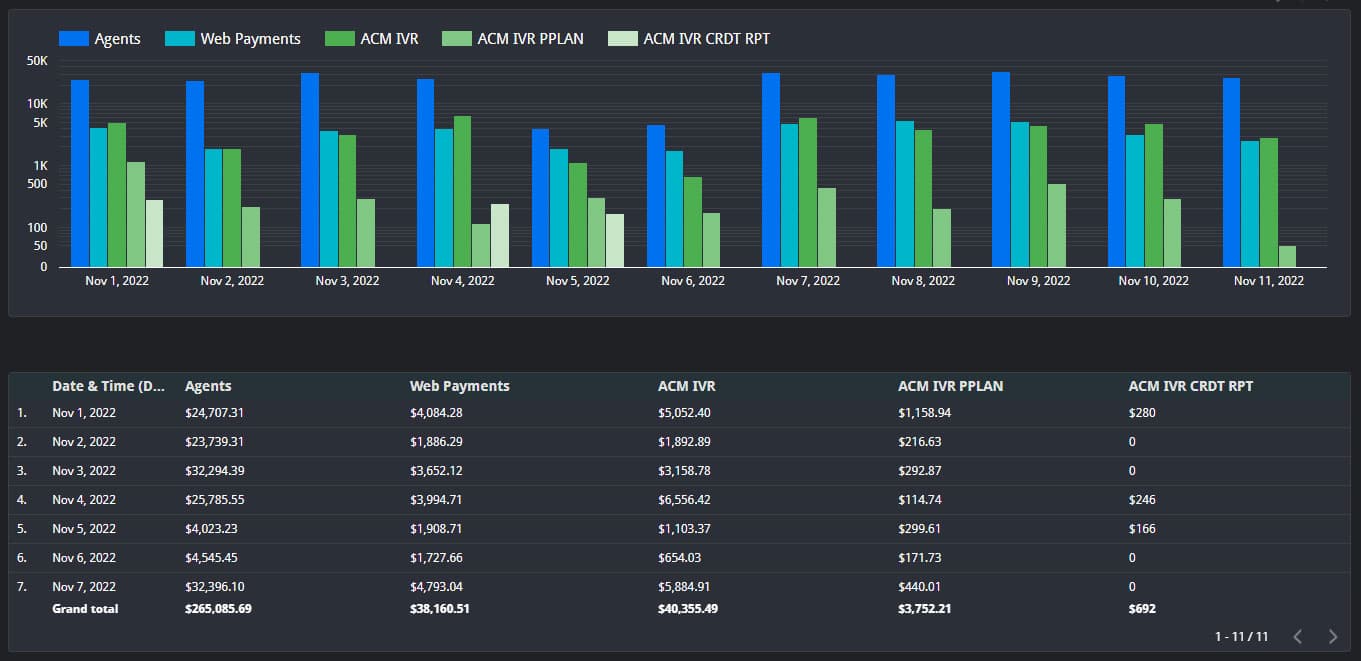
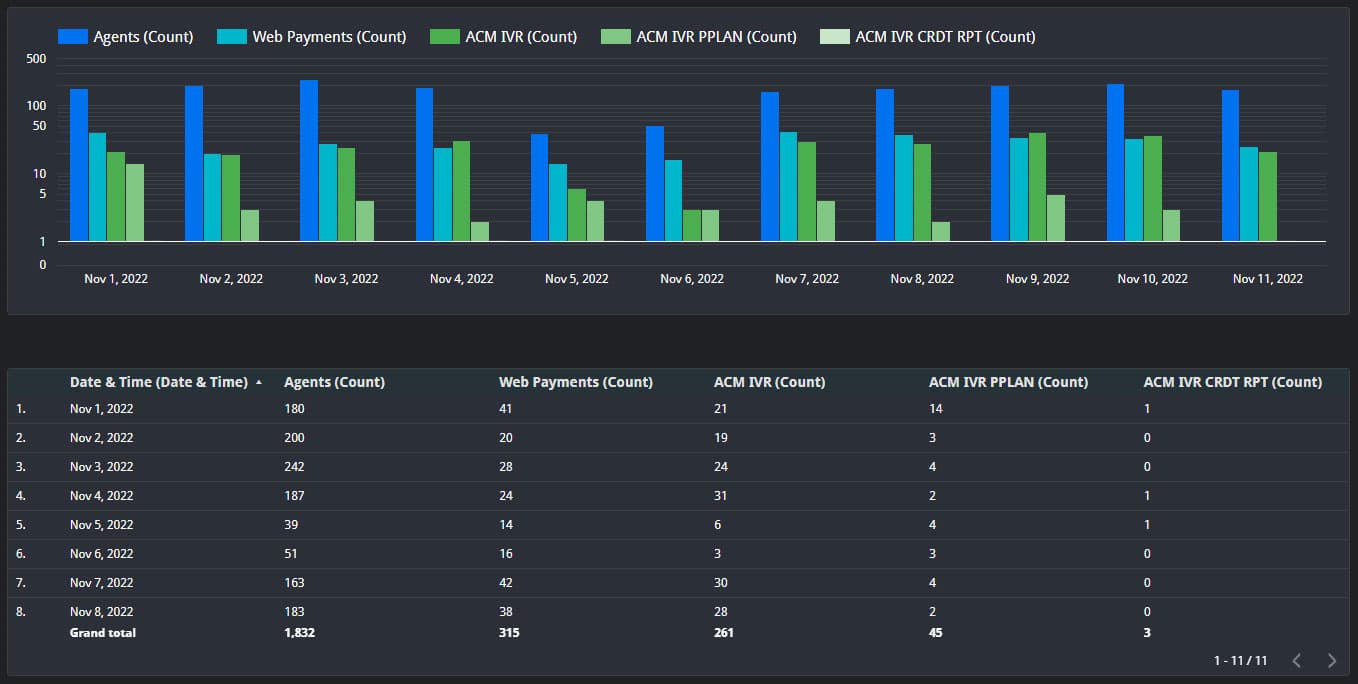
What's the cost-per-recovered-dollar across channels?
How long until self-service completion plateaus on a new flow?
Your warehouse, your rules.
Dashboards live in the SIS platform, but the underlying data is yours. Export to CSV, push into S3, stream to Snowflake or BigQuery, or pull via API into Looker, Tableau, or Power BI.
See a sample report.
We'll send a redacted weekly report from a comparable client deployment.